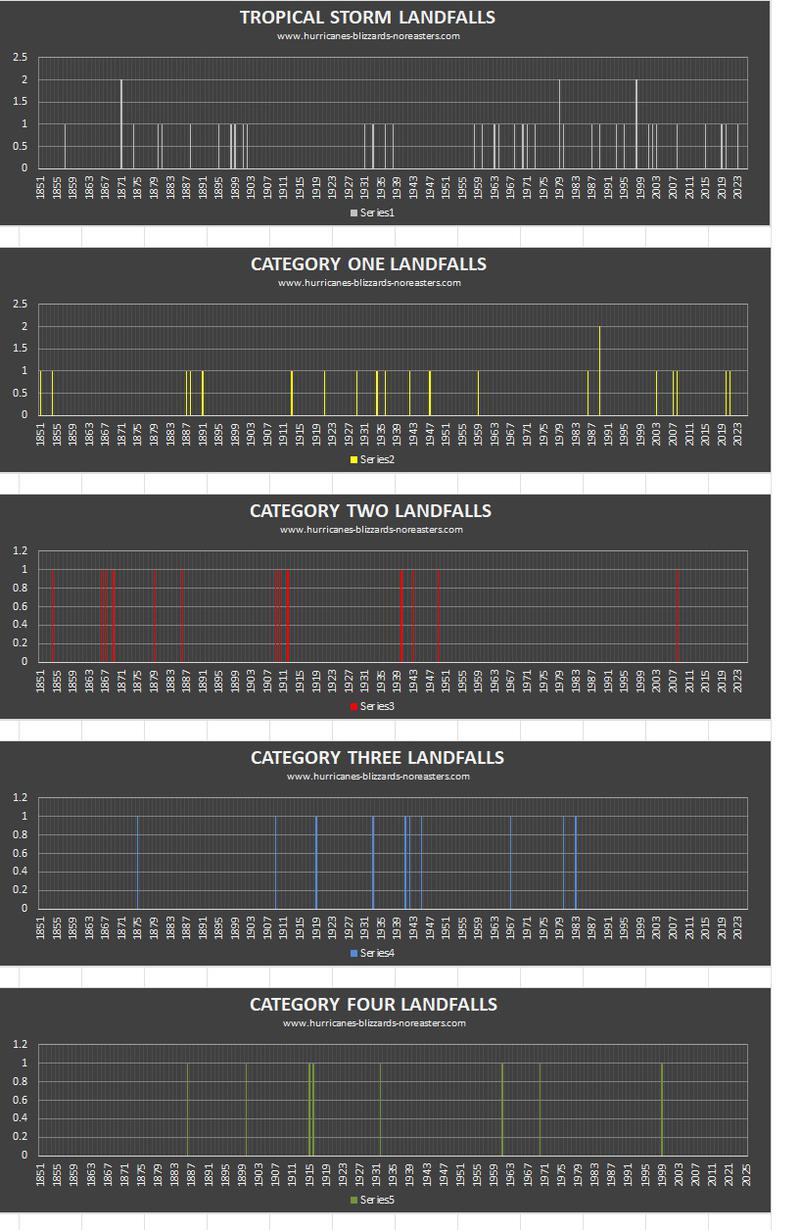
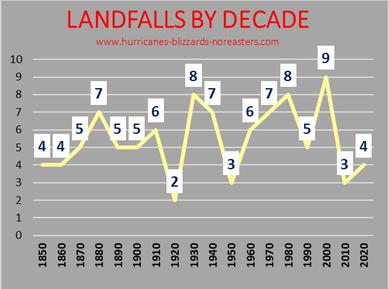
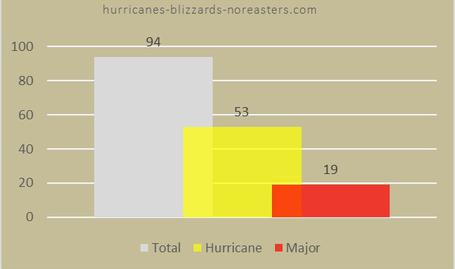
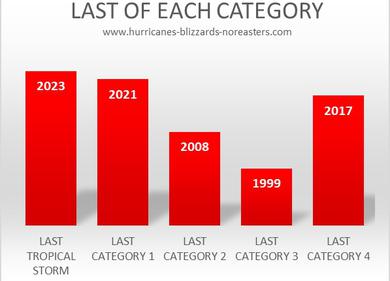
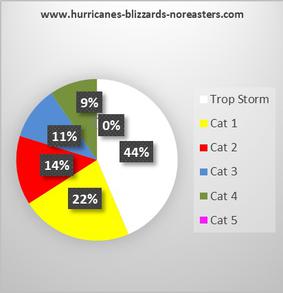
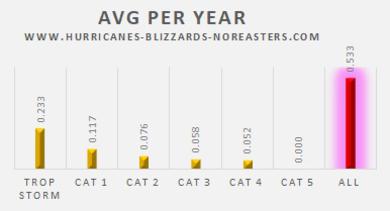
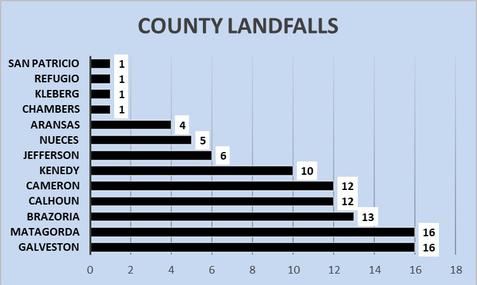
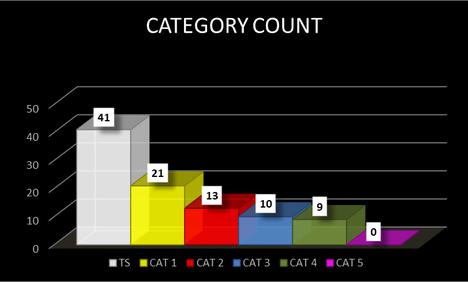
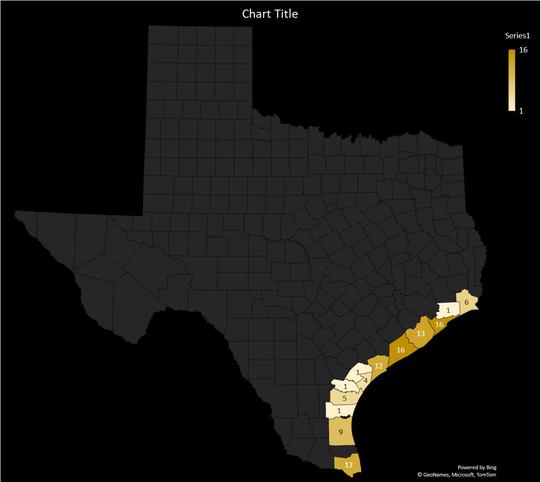
Here is are graphs and year by year list of all tropical systems that have made landfall on the Texas coast. At then end of the list I have included the most consecutive with a landfalling system, the most consecutive years without a landfalling system, most systems in one year, last tropical system, and last of each category. ****** note, these are only landfalling systems, this does not include brushes, systems coming in from another state, only systems that have made landfall on the states coast!!!
For other states, click on state name...TEXAS LOUISIANA MISSISSIPPI ALABAMA FLORIDA GEORGIA SOUTH CAROLINA NORTH CAROLINA VIRGINIA DELAWARE MARYLAND NEW JERSEY NEW YORK CONNECTICUT RHODE ISLAND MASSACHUSETTS NEW HAMPSHIRE MAINE
For other states, click on state name...TEXAS LOUISIANA MISSISSIPPI ALABAMA FLORIDA GEORGIA SOUTH CAROLINA NORTH CAROLINA VIRGINIA DELAWARE MARYLAND NEW JERSEY NEW YORK CONNECTICUT RHODE ISLAND MASSACHUSETTS NEW HAMPSHIRE MAINE
TEXAS LANDFALLING TROPICAL HISTORY
YEAR BY YEAR
*********VISIT HURRICANECITY.COM TO GET TROPICAL INFORMATION ON OVER 150 CITIES*********
BUSIEST 5 YEAR PERIOD --- 6 LANDFALLS 1932-36, 2007-2011
BUSIEST 10 YEAR PERIOD --10 LANDFALLS 1999-08
BUSIEST 15 YEAR PERIOD --13 LANDFALLS 1929-43, 1931-45, 1994-08, 1995-09, 1997-11, 1998-12
BUSIEST 20 YEAR PERIOD --- 17 LANDFALLS 1989-08
BUSIEST 25 YEAR PERIOD --- 19 LANDFALLS 1979-03, 1984-08, 1985-09, 1986-10, 1987-11
BUSIEST 40 YEAR PERIOD --- 29 LANDFALLS 1969-08, 1970-09
BUSIEST 50 YEAR PERIOD --- 36 LANDFALLS 1959-08
BUSIEST 30 YEAR PERIOD --- 24 LANDFALLS 1979-08
# Infolinks - Updated 06/24/2024
infolinks.com, 2929718, direct
appnexus.com, 3251, reseller
pubmatic.com, 156872, reseller, 5d62403b186f2ace
sonobi.com, 0e0a64d7d3, reseller, d1a215d9eb5aee9e
lijit.com, 268479, reseller, fafdf38b16bf6b2b
google.com, pub-6373315980741255, reseller, f08c47fec0942fa0
google.com, pub-4299156005397946, reseller, f08c47fec0942fa0
indexexchange.com, 191306, reseller
openx.com, 543174347, reseller, 6a698e2ec38604c6
triplelift.com, 11582, reseller, 6c33edb13117fd86
xandr.com, 3251, reseller
lijit.com, 268479-eb, reseller, fafdf38b16bf6b2b
google.com, pub-7858377917172490, reseller, f08c47fec0942fa0
google.com, pub-1463455084986126, reseller, f08c47fec0942fa0
video.unrulymedia.com, 2221906906, reseller
33across.com, 0010b00002CpYhEAAV, reseller, bbea06d9c4d2853c
rubiconproject.com, 16414, reseller, 0bfd66d529a55807
pubmatic.com, 156423, reseller, 5d62403b186f2ace
appnexus.com, 10239, reseller, f5ab79cb980f11d1
openx.com, 537120563, reseller, 6a698e2ec38604c6
rubiconproject.com, 11006, reseller, 0bfd66d529a55807
onetag.com, 598ce3ddaee8c90, reseller
improvedigital.com, 2016, reseller
themediagrid.com, V19ZSB, reseller, 35d5010d7789b49d
zetaglobal.net, 533, reseller
disqus.com, 533, reseller
sharethrough.com, UvcAx8IL, reseller, d53b998a7bd4ecd2
aps.amazon.com, de948cab-9232-4f2a-90f5-794be75952c6, reseller
media.net, 8CUY6IX4H, reseller
smartadserver.com, 3238, reseller, 060d053dcf45cbf3
sharethrough.com, 5pFlvV45, reseller, d53b998a7bd4ecd2
sharethrough.com, 1SghQadK, reseller, d53b998a7bd4ecd2
rubiconproject.com, 18694, reseller, 0bfd66d529a55807
mgid.com, 43615, reseller, d4c29acad76ce94f
rubiconproject.com, 9655, reseller, 0bfd66d529a55807
amitydigital.io, 493, reseller
152media.info, 152M658, reseller
appnexus.com, 11924, reseller, f5ab79cb980f11d1
qortex.ai, 194667, reseller
rubiconproject.com, 24138, reseller, 0bfd66d529a55807
emxdgt.com, 1918, reseller, 1e1d41537f7cad7f
conversantmedia.com, 100316, reseller, 03113cd04947736d
orangeclickmedia.com, C-1100, reseller
freewheel.tv, 1602928, reseller
freewheel.tv, 1602929, reseller
amxrtb.com, 105199704, reseller
loopme.com, 12754, reseller, 6c8d5f95897a5a3b
rubiconproject.com, 20744, reseller, 0bfd66d529a55807
adform.com, 3083, reseller
smaato.com, 1100056418, reseller, 07bcf65f187117b4
outbrain.com, 00595a29fe0f0efa37cd675959d6128c78, reseller
adyoulike.com, 1f301d3bcd723f5c372070bdfd142940, reseller

